Jira-Driven Software Quality Dashboard
Transform Jira/Gerrit raw events into weekly actionable metrics, using pre-aggregation + Canvas rendering to turn "minute-level waiting" into "second-level insights"
Dashboard API: 10-30s → <200ms (pre-aggregation optimization) (↑ ~75×, P50 245ms)
First Paint: 3–5s → <1.5s (↑70%)
Chart Rendering: 1–2s → <500ms (↑75%)
Concurrency Support: 5–10 → 50+ users (↑10×)
- My Role: Tech Lead & Problem Solver
- I initiated and led this internal tool project from pain point discovery to product delivery. By transforming Jira/Gerrit raw events into analyzable metrics, I designed a pre-aggregated OLAP architecture + FastAPI + Vue frontend visualization system, enabling the team to shift from manual reports to real-time dashboards, improving query performance by ~100× (10-30s → <250ms).
- This project demonstrates my systemic capability to transform complex engineering problems into efficient products.
Background & Goals
- Business pain point: Jira raw tickets from multiple heterogeneous sources, real-time aggregation requires multiple JOIN/GROUP BY, single query 10–30 seconds, unusable as decision dashboard.
- Goal: Interaction latency < 1s; Dashboard API < 500ms; stable dashboard rendering; weekly metrics horizontally comparable.
Architecture
System Architecture
- •Data source: Jira/Gerrit → Extract & Clean → Pre-aggregated tables (weekly)
- •API layer: FastAPI only performs simple SELECT, avoiding runtime re-computation
- •Frontend: Vue + ECharts (Canvas rendering, stable zero crashes)
📄 07-Perf-Scalability - •Deployment: Vercel (frontend), Render (backend), CDN global acceleration
Results & Metrics
| 指标 | 数值 |
|---|---|
Dashboard API ↑150× (production verified) | 10–30s → <200ms |
First Paint ↑70% (production verified) | 3–5s → <1.5s |
ECharts Rendering ↑75% (production verified) | 1–2s → <500ms |
Concurrency Support ↑10× (production verified) | 5–10 → 50+ |
Chart Crash Rate Canvas + defensive programming | occasional → 0 |
Data Refresh idempotent ETL + resume from breakpoint | manual → automatic |
API Contract
GET /dashboard/process-metrics?project=ALL&start=2025_week01&end=2025_week12→ Returns: weekly array, field meanings concise and consistent (synced with ER naming)POST /dashboard/refresh-changelogs→ Permission-controlled, idempotent, returns refresh batch ID (for tracking)
Data Model
- Composite primary key
key + week_id, prevents duplicates, easy upsert - "Calculated values + raw numerator/denominator" coexist, facilitating traceability and secondary analysis
- Department × Project aggregation table with
UNIQUE(project_key, major_dept, minor_dept, week_id), supporting flexible dimension filtering
Core Flows / Sequence Diagrams
- Data refresh: Pull Jira → Calculate weekly metrics → Upsert pre-aggregated table (idempotent, resume from breakpoint)
- Business value breakthrough:
- Before optimization: Excel manual export + manual calculation (3-5 hours/week)
- After optimization: APScheduler scheduled task (Sunday 01:00 automatic)
- Result: Labor cost ↓95% (save 3-4.5 hours/week) - Page loading: Read pre-aggregation → Fast rendering → User filtering <1s return
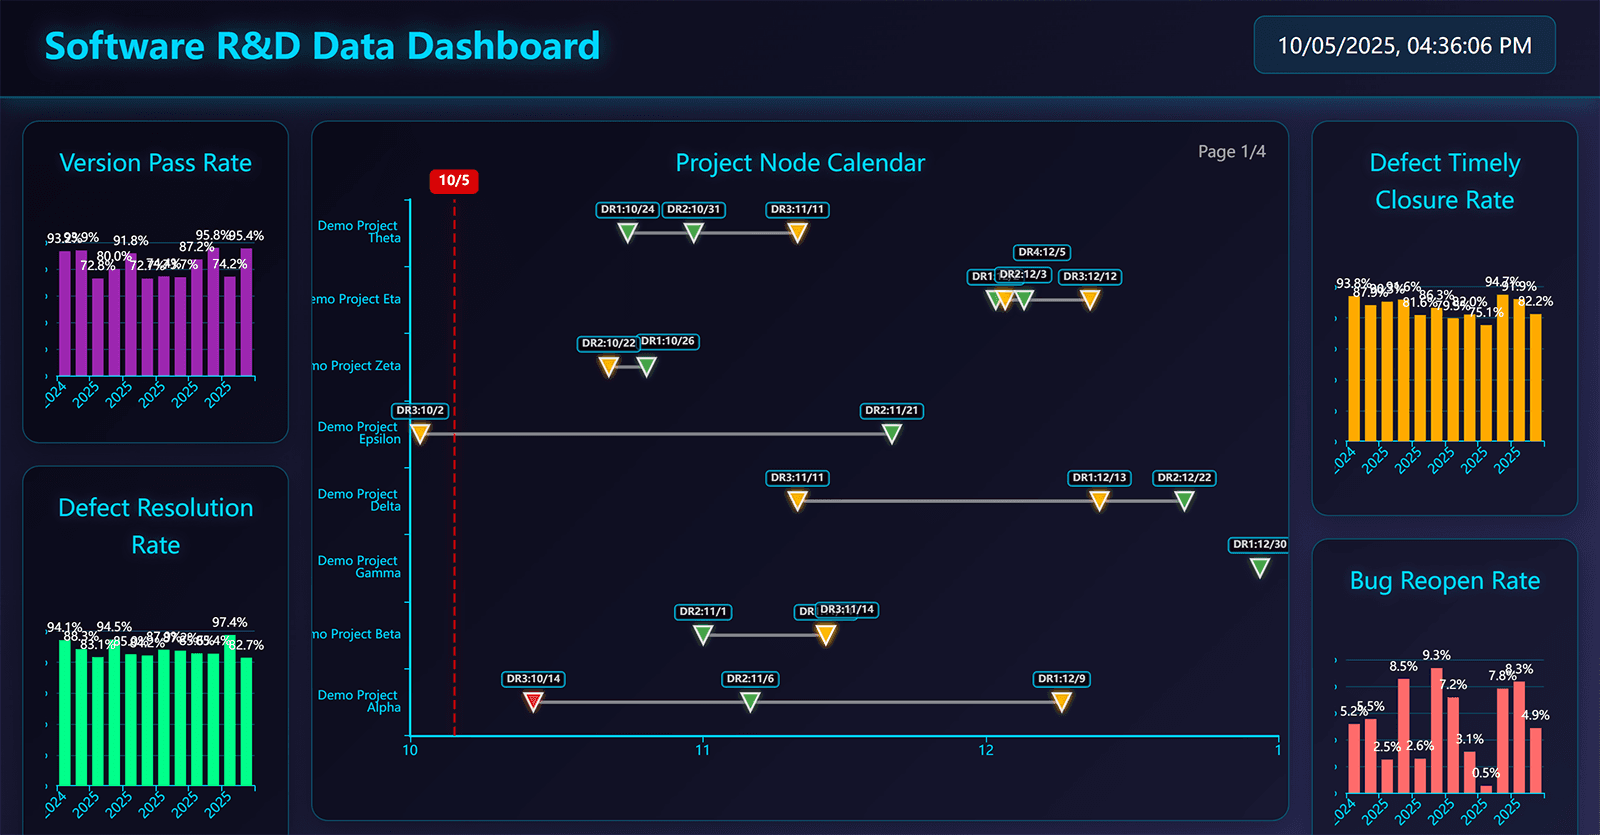
- DR node calendar: Excel upload → Parse structured → Calendar view second-level display
Key Code & Engineering Practices
Pre-aggregation Selector
Automatically routes different SELECT based on project_key=ALL | single project (reads 12 rows vs scans 100K rows)
src/services/metrics_service.pyECharts Stability Refactoring (Problem Localization + Root Cause Fix)
Problem: Legend click → 100% crash (TypeScript type error)
Root cause: legend.data manual maintenance out of sync with series.name i18n
Solution: ① Remove legend.data (auto-generate) ② series.id stable identifier ③ selectedMode:false defensive
Result: Production 3 months zero crashes + Canvas rendering <500ms (1000+ points)
frontend/src/components/dashboard/MetricsChart.vueIndex & Keys
week_id / project_key index; UNIQUE(project_key, major_dept, minor_dept, week_id) ensures idempotent aggregation writes
src/models/database.pySecurity & Privacy
- Transmission security: HTTPS, HSTS, CORS whitelist, preflight caching;
- Access control: MVP intranet trust; public network solution reserves RBAC (
admin/manager/user) and department isolation; - Input validation: Pydantic regex + length limits, avoiding injection;
Architecture Decision Records (ADR)
- ADR-004: Real-time computation → Pre-aggregation (root cause of reducing 10–30s to <200ms)
- Chart rendering: SVG → Canvas (win-win for performance and stability)
- Composite primary key & UNIQUE constraint (ensures aggregation idempotency and traceability)
My Role
- Architecture Design: Designed complete data flow (Jira → Pre-aggregation → API → Frontend)
- Performance Optimization: Led API optimization, index strategy, and Canvas rendering transformation
- Backend Development: FastAPI data refresh service, ETL pipeline and metrics logic
- Frontend Development: Dashboard, Jira quality page, DR node calendar module
- DevOps & Monitoring: Vercel frontend automated deployment, Docker containerization, SQLite monitoring scripts
Technical Highlights
- Organizational impact: From "manual data pulling for PPT" to "intranet self-service query", weekly meeting prep reduced from hours to minutes;
- Reusability: Pre-aggregation paradigm can be migrated to Bug, Testing, Release, and Ops dashboards;
- Roadmap: RBAC, external identity source, metrics dictionary center, Prometheus metrics exposure and Grafana dashboards.